How to Create a Map with Open Data: The Ultimate Map of French Cheese

This week, OpenDataSoft has cooked something special. After studying the Council of Paris, French trains' Open Data, Gender Equality in Europe and the state of Open Data in 2014, OpenDataSoft continues its Open Data Weekly series to show you how to create a map with Open Data. Au menu: the ultimate map of French Cheese, all in Open Data. Grab a piece of baguette and read on!

The Open Data Map of French Cheese
A beautiful map of French cheese in Open Data
Extracting Data: Scrapping Wikipedia with Python
As soon as we had decided to create this map, the famous General de Gaulle punch line came to our mind:
“How can you govern a country which has two hundred and fifty-eight varieties of cheese?”
To make things even more complex, we had three requirements:
- Have an exhaustive list.
- Each cheese should be associated with its production department to streamline geotagging.
- Get cheeses’ pictures whenever possible.
So we focused on finding a list that would be both exhaustive and hierarchical. This would allow us to easily parse it. After several attempts, we found this incredible list of some 338 cheeses (in French).

Clement, member of our R&D team, parsed it for us. Using Beautiful Soup Python library, he was able to create a clean CSV containing:
- The name of each cheese associated with its department of production.
- The image of each cheese whenever it was available.
- The type of milk: cow, goat and sheep.
- Wikipedia pages in English (when available) and in French.
We uploaded our dataset in a popular spreadsheet software for a quick cleaning. Cheese factory names were hiding among cheeses and types of milk needed to be harmonized. Thus:
- “Montbeliarde Cow” became “Cow Milk”
- “Fresh Goat Milk” became “Goat Milk”
Uploading data onto a turnkey data platform
After cleaning our CSV, we uploaded The French Cheese Dataset on the OpenDataSoft demo portal.
To point all 338 cheeses on our map, we used one of our native processors to convert department names into coordinates.
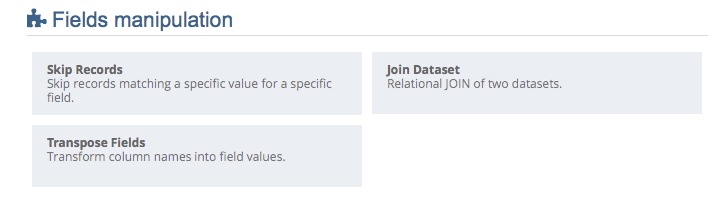
Our “Joined Dataset” processor
This processor converted all department names into geographical coordinates based on geographical data contained in a second dataset. Even better, the platform automatically completed our dataset with relevant information on the fly.
The platform also converted all image URLs into images to be displayed in an embeddable gallery.
All 338 French cheeses embeddable everywhere.
How to Create a Map with Open Data
To create this beautiful map, we used our Cartograph tool. Cartograph allows our users to layer Open Data from multiple sources on a map within minutes.
All French cheeses on our standard map tiles.
We decided to make things even more fun by creating a specific map background. Nothing easier: a graphic tablet, Illustrator, bright colors and it was all done.

Having fun with Illustrator and Gifs.
In order to use our illustration as a map background, we used MapTiler. This software converts map illustrations into web standard map tiles. We simply had to point which parts of our custom map were matching MapTiler standard map. We used the northern tip of Corsica, Brest and the east coast of England.
Our only technical requirement was that our illustration had to fit in a 10,000-by-10,000-pixel square. So we limited our custom map to Europe.
We exported our custom map into a standard format: MbTiles. This allowed us to upload it onto our platform via MapBox.
And this is when a problem occurred: a problem that we – French metropolitans – did not foresee.
La Réunion : 6th cheese producer department in France
La Réunion is a French island south of Madagascar. La Réunion is the sixth largest cheese producer in France.
As we were saying earlier, our custom map couldn’t exceed Europe. We were technically limited by our 10,000-by-10,000-pixel square. So, what was our workaround?
In order to keep La Réunion cheeses in the dataset, we hacked the display like this:
- We kept data related to La Réunion cheeses into the dataset.
- We filtered out these results to show up on our map.
- We draw a specific map for la Réunion.
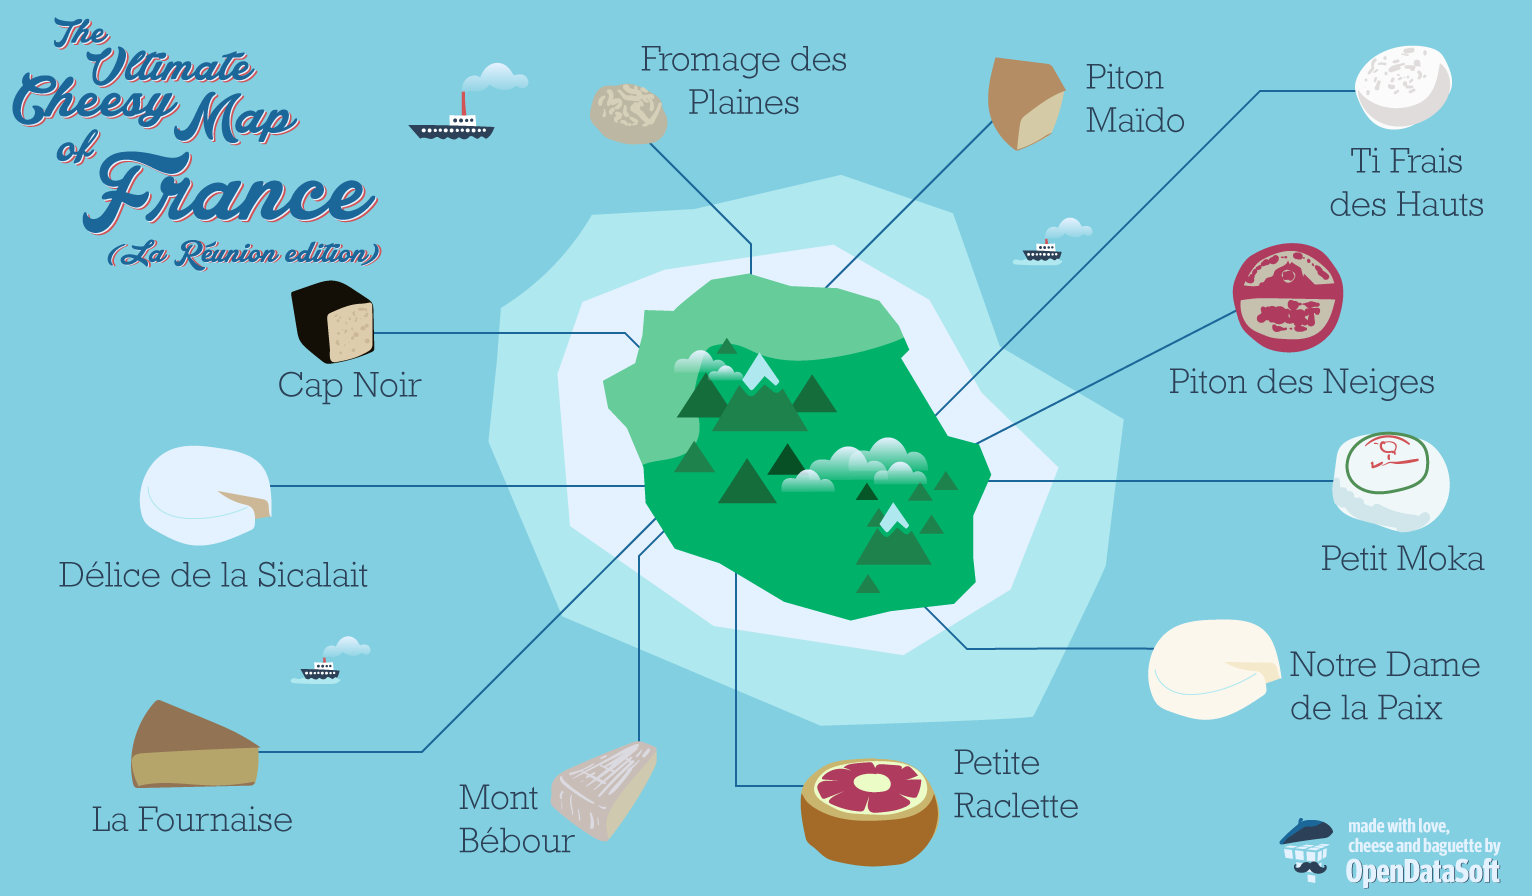
The most beautiful map of La Réunion cheeses ever designed.
Hopefully, you will find all these fantastic cheeses in the original dataset.
This was a brief example of some key features offered by OpenDataSoft SaaS solution: Cartograph, filters, picture galleries… The OpenDataSoft platform makes it super-easy to publish datasets as data visualizations and APIs within a few clicks.

In today’s digital-first world, data sharing and use is essential to effective local government operations. Based on our recent webinar, Opendatasoft customers the City of Kingston and the Town of Cary explain how data portals are helping them to deliver on the needs of their citizens and employees.

Driven by the need to decarbonize, increase efficiency and meet changing customer needs, the transport and mobility sector is undergoing a rapid transformation. Data is at the heart of this, with data portals critical to building an effective, sustainable and customer-centric transport ecosystem.

Across the globe cities and municipalities are transforming themselves into smart cities, improving the urban environment for citizens, visitors, and businesses, while boosting efficiency and sustainability. In this blog we explain what a smart city is and how to build one successfully.
In today’s digital-first world, data sharing and use is essential to effective local government operations. Based on our recent webinar, Opendatasoft customers the City of Kingston and the Town of Cary explain how data portals are helping them to deliver on the needs of their citizens and employees.
Driven by the need to decarbonize, increase efficiency and meet changing customer needs, the transport and mobility sector is undergoing a rapid transformation. Data is at the heart of this, with data portals critical to building an effective, sustainable and customer-centric transport ecosystem.
Across the globe cities and municipalities are transforming themselves into smart cities, improving the urban environment for citizens, visitors, and businesses, while boosting efficiency and sustainability. In this blog we explain what a smart city is and how to build one successfully.