How Amsterdam Uses Urban Data to Build a More Sustainable City
Read this article to learn about Amsterdam's Energy Atlas project and how the city uses urban data to build a more sustainable city.

As the volume of data cities generate over the course of their day-to-day activities steadily augments, cities are increasingly asking how this trove of urban data can be used to improve their operations and address the many challenges they face.Amsterdam is one such city. Their Energy Atlas project, for example, explores the use of urban data to improve energy management. It is a promising project that can be applied to multiple municipal challenges, and replicated by many cities.
Making Urban Data Accessible: A Prerequisite for Urban Innovation
There are many solutions available to cities to improve their energy efficiency and reduce their carbon footprint, including expanding solar and wind energy production, improving energy efficiency in buildings, and recovering heat waste from datacenters and other sources.
However, realizing these improvements requires the engagement of all urban stakeholders: public decision-makers, economic partners, citizens, and civil society at large.
The challenge with such collaboration is that often the different actors aren’t aware of the opportunities available, and they often lack the data needed to make optimal decisions. As a result, energy management projects (like those in many other sectors) too rarely pass from concept to action.
To rectify this situation, stakeholder engagement has to be paired with the sharing of relevant urban data. With this in mind, the City of Amsterdam launched the Energy Atlas service in 2014. It is a project undertaken in the context of Amsterdam’s participation in the EU’s low-carbon, smart-city program TRANSFORM.
Amsterdam's "Energy Atlas" Project
As with many cities around the globe, Amsterdam is committed to transitioning from fossil fuels to clean and renewable energy. The city’s goal is to reduce its CO2 emissions by 40% from its 1990 level by 2025.
It’s an ambitious objective that is set against a backdrop of high energy expenditures (approximately 2 billion euros annually), and strong anticipated population growth. The city expects its current population of 840,000 inhabitants to increase by 100,000-150,000 people in the near future.
As population growth is typically accompanied by an increase in energy consumption and production, the city is facing a special challenge in reconciling growth with its desire to be an eco-responsible, low-carbon emitter. For Amsterdam, there is no doubt that part of the solution to this challenge is to be found in sharing the city’s urban data.
With Energy Atlas, Amsterdam has chosen to open access to data related to energy production and consumption. They are hoping this data can be used to answer important questions like: How much energy is being used by a given neighborhood? What quantity of heat is produced by an industrial park? What are the opportunities for using wind and solar energy? What are the possibilities of matching energy demand with renewable energy supply?
Amsterdam’s Energy Atlas can respond to these questions. It can:
- Give all city stakeholders access to essential urban data
- Permit actors to make smart, collaborative energy management decisions
- Move the city forward in its energy transition
Energy Atlas provides open access to the city’s energy data through interactive maps. Here are a few of these maps.
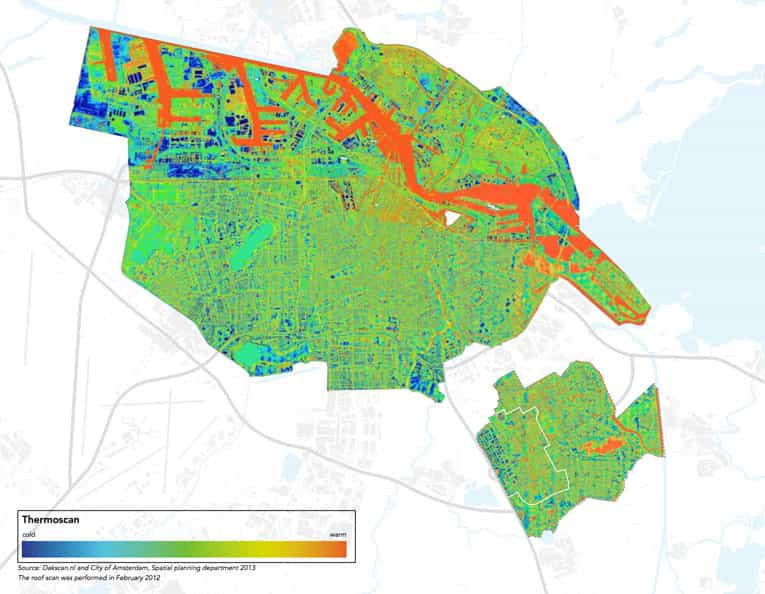
Thermal Energy Loss Map
This map permits identification of thermal energy losses detectable by rooftop temperature levels. Rooftops are color-coded to indicate the level of this heat loss, ranging from blue for low temperatures (low loss) to red for high temperatures (high loss).

By identifying buildings exhibiting a high loss of heat, urban stakeholders have the opportunity to work with building owners to improve the thermal insulation of their buildings and help them realize energy savings.
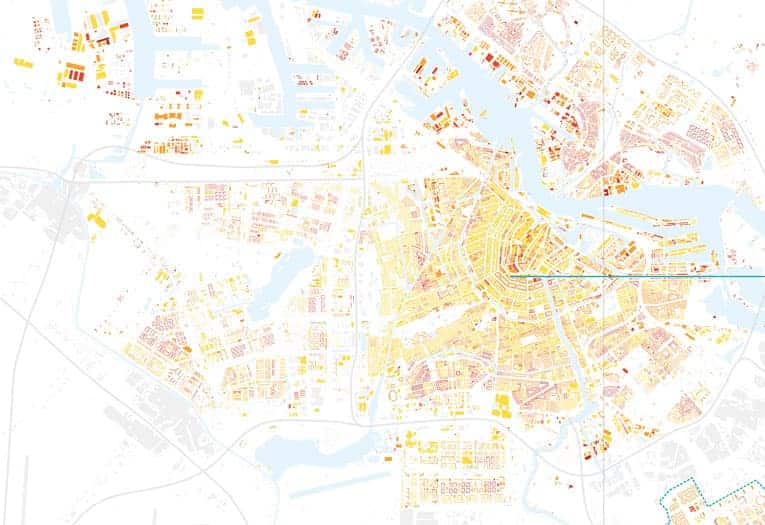
Map of Solar Potential
Akin to Google’s Project Sunroof in the U.S., the Energy Atlas’s solar potential map aims to identify the suitability of buildings for rooftop solar panel installations. The solar potential of city rooftops are calculated based on the energy furnished by solar rays for a given location and the orientation of the city rooftop.

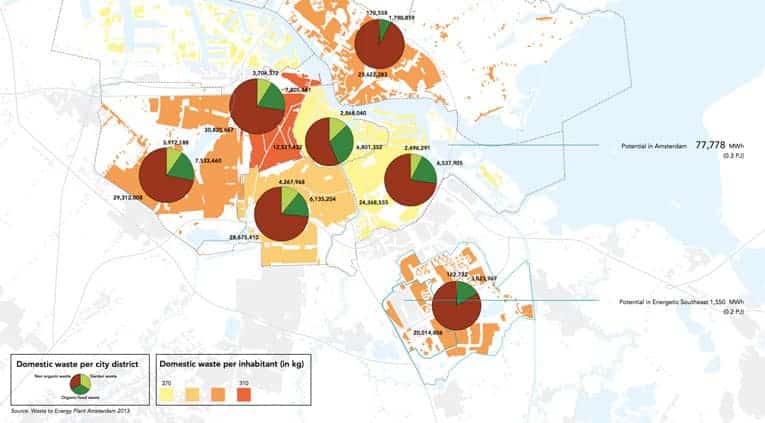
Map of Waste Heat
Waste heat is heat generated by an industrial process, such as the operation of computers in a data center or trash incineration, which is dissipated into the atmosphere. Waste heat recovery is the process of capturing this otherwise wasted heat and using it as an energy source. This map identifies the sources and level of waste heat in the city to inform waste heat recovery programs.

These three maps represent only a portion of the data available through the Energy Atlas, but they provide good insight into the opportunities made possible by opening urban energy data.
You can access the interactive maps here. The data are also available for reuse in CSV, MIF, and MID formats. Be sure to download Opendatasoft’s checklist for opening your own energy data.


