ODS Studio: Making data visualizations everyone’s business
With our new ODS Studio tool, you can design 100% responsive data stories and reports in minutes, without needing to write a line of code or perform complex calculations.

Data is at the heart of your daily working life. Not only is it what you actually create in your role, but it is also a key resource for managing and effectively supporting how you work. Understanding your data is crucial to working successfully. That’s where data visualizations come in, but creating them can be complex and time-consuming.
To help, Opendatasoft is excited to launch ODS Studio, our new tool designed to create charts and indicators quickly and intuitively, then organize them simply on a web page without needing to write code, and finally easily share them with colleagues, customers and other stakeholders.

Before getting into the specifics of Studio, let’s take a moment to look at the bigger picture.
The need to allow more people to create data experiences
Freeing data from spreadsheets
Your first encounter with data was probably in the cold, yet familiar confines of an Excel spreadsheet. You’ve navigated through a multitude of rows and columns to find important values. You’ve probably performed some math using formulas. You might have even generated charts right there on your spreadsheet, which you then reused in slides or PDF reports you shared with colleagues by email or messaging/collaboration tools.
However, no matter how good your skills are with Excel (or any spreadsheet software), there are limitations to what you can achieve:
- The human eye reads tabular visualizations relatively poorly: As values are all shown on the same plane it is difficult to highlight key information.
- While it is possible to create charts with spreadsheets, multiple visualizations are only occasionally aggregated and shared in separate, static documents, making it difficult to understand and reuse your data over time.
Releasing data visualizations from expert hands
Interactive data visualizations are a remarkably effective way to render your data in a structured, intelligible, and memorable way.
However, two factors hold back wider creation of visualizations:
- Firstly, who actually has the time to train themselves to use advanced business intelligence tools to create these visualizations? Equally it would only require a fraction of the tool’s features to create the experiments and quick data visualizations you want to build. Those other features are primarily for data experts.
- Secondly, many teams don’t have people with HTML/CSS skills, and you need to know the basics of these languages to use Opendatasoft’s native page editor.
This is where ODS Studio comes in
Data visualizations support your business, but they are not your business. That’s why Opendatasoft has launched ODS Studio, a new tool for designing data stories and KPI reports without having to code. Anyone can use it, regardless of their role and skills.
With ODS Studio, it takes less than an hour to design visualizations such as:
- A team activity report that tracks, compares, and improves your results.
- A decision-support service backed by data analysis reports, which can be marketed to your customers and prospects.
- Your company’s public non-financial report showing your CSR impact.
- Your organization’s performance report that highlights the quality of your services and the success of your achievements to all your stakeholders.
- Your local authority’s budget report to communicate your public expenditure and revenues with full transparency.
- The data story on the front page of your website, enabling you to stand out from the crowd and gain new readers and followers.
Why make it complicated when it can be simple?
With ODS Studio, the most impactful data visualizations that are relevant to making your data real and effective can be created with just a few clicks of your mouse.
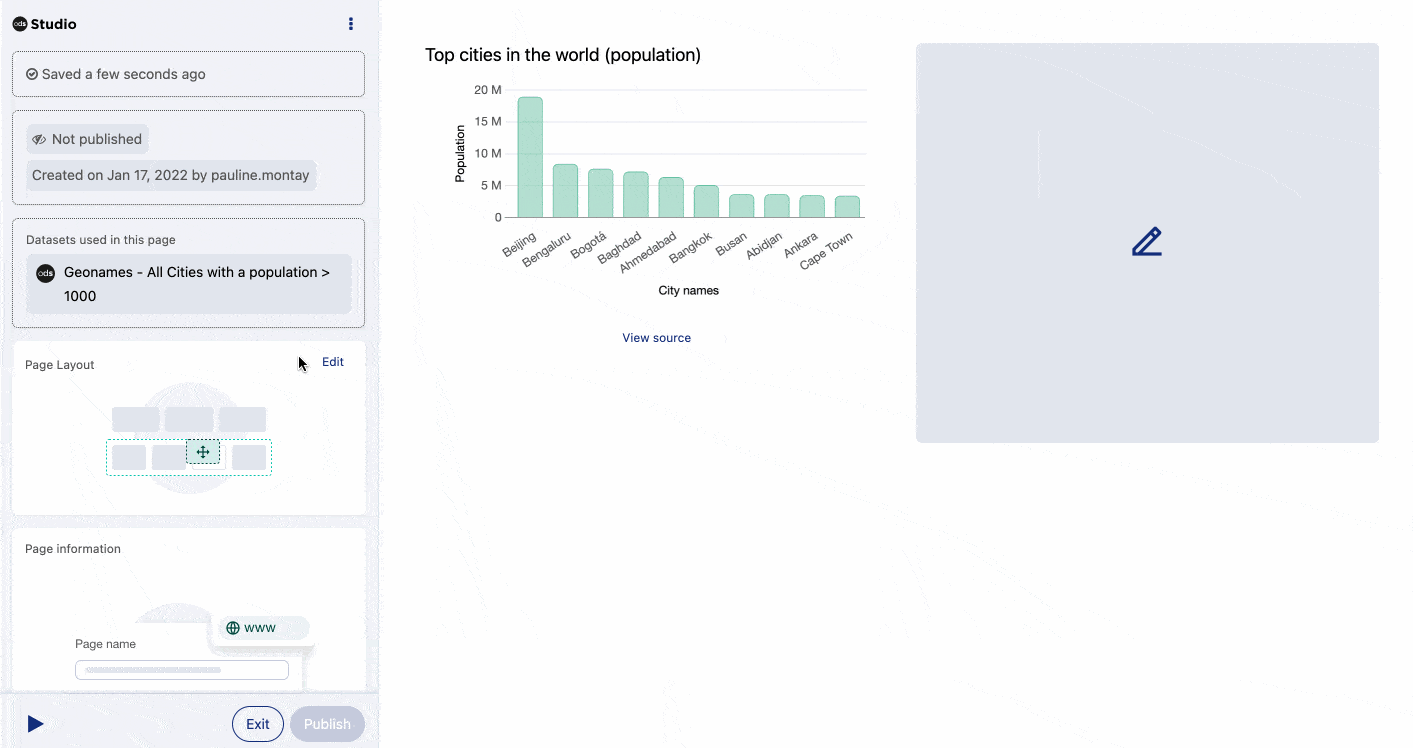
No code
By simply dragging and dropping, you can organize the different sections of your page and the graphics, indicators, and text areas you want to combine within them.
Intuitive user experience
The interface guides you step-by-step through designing a data story or report, from selecting your source dataset to choosing a visualization, configuring the graphs/KPIs, and customizing their appearance.
All in a single screen
You never need to leave ODS Studio to create your visualizations. Your data catalog is accessible directly from the tool, along with all options you need for sharing with users and user groups.
Automatic calculations
You don’t need to know formulas in your head in order to compare two results or establish an average. Simply choose the type of operation you need to perform in your graphs and pick indicators from a list of suggestions.
Instant preview
You can see the result of every action in real-time, and you can preview how the page will look when integrated into your data portal or data service.
Create KPI reports in a fraction of the time
The very first time she used Studio, Amélie Hervé, our client in the local government of Mayenne in France, was able to combine seven performance indicators and four graphs on the same page to report on digital equipment usage in local schools. It took her just 50 minutes to create the page, compared to half a day in the past.
Mayenne department
Building the data experiences of today and tomorrow
Data visualizations at Opendatasoft: The best of both worlds
While Opendatasoft makes it easy for any business expert to create reporting and data storytelling pages with ODS Studio, data experts can still benefit from using the in-depth HTML/CSS page editor, which has been available since the platform was created in 2011.
This enables analysts and developers to build complex, fully customizable dashboards with the help of Opendatasoft’s open-source widgets, as well as the components and templates available in our Code Library.
This is just the beginning
Opendatasoft’s all-in-one platform is constantly evolving. As we write, our team is already working on updates to ODS Studio to:
- Enhance content with more options for graphs (multi-series, breakdown, etc.), along with types of graphs and visualizations, such as maps and images.
- Promote customization through more detailed management of page styles and display colors.
- Streamline collaboration and sharing through synchronous editing, social media posting, and easy CMS integration.
- Improve the data visualization consumer experience with content that is accessible to as many people as possible through compliance with the WCAG AA standard.


