Who won the Power Users Awards in 2020?
We decided to create the Power Users Awards! They were announced during our Data on Board 2020 event! Discover the most impressive catalogue, the most original dataviz, the most inspiring initiatives, the most useful services, the most active users, etc.

We have wonderful clients, that’s for sure. They’re all Data Heroes.
This year, we wanted to let them know how proud we are of what they’re creating, and we decided to create the Power Users Awards! They were announced during our Data on Board 2020 event, and the winners received a little surprise in their letterbox…
Let’s relive in the “ceremony” !
The Most Impressive Catalogue
The award goes to… KAPSARC, SAUDI ARABIA
Historical energy data for researchers & top 10 indicators
The Most Original Dataviz
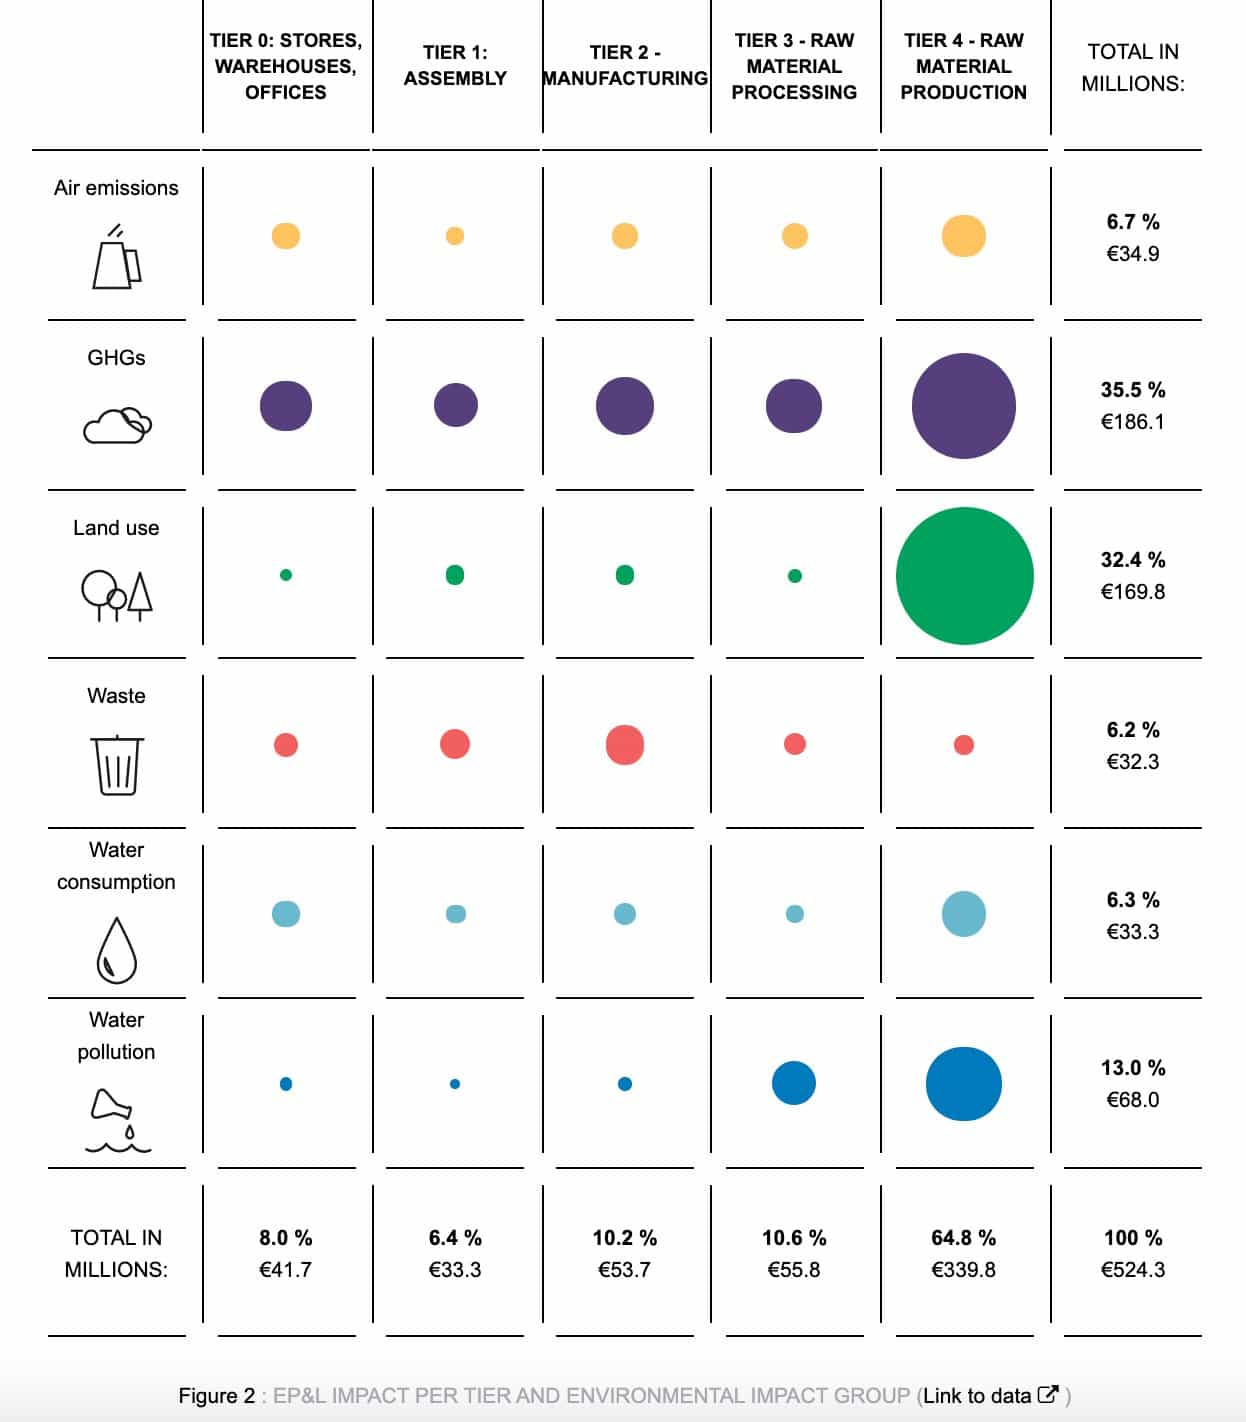
The award goes to… EP&L REPORT, KERING GROUP
Bubble chart about environmental impacts, with filters by year and business unit
The Most Inspiring Initiatives
The award goes to… Vancouver, Canada
With VanDashboard, the city made transparency a trend
The award also goes to… MEXICO CITY, MEXICO
Social indicators and publication plans
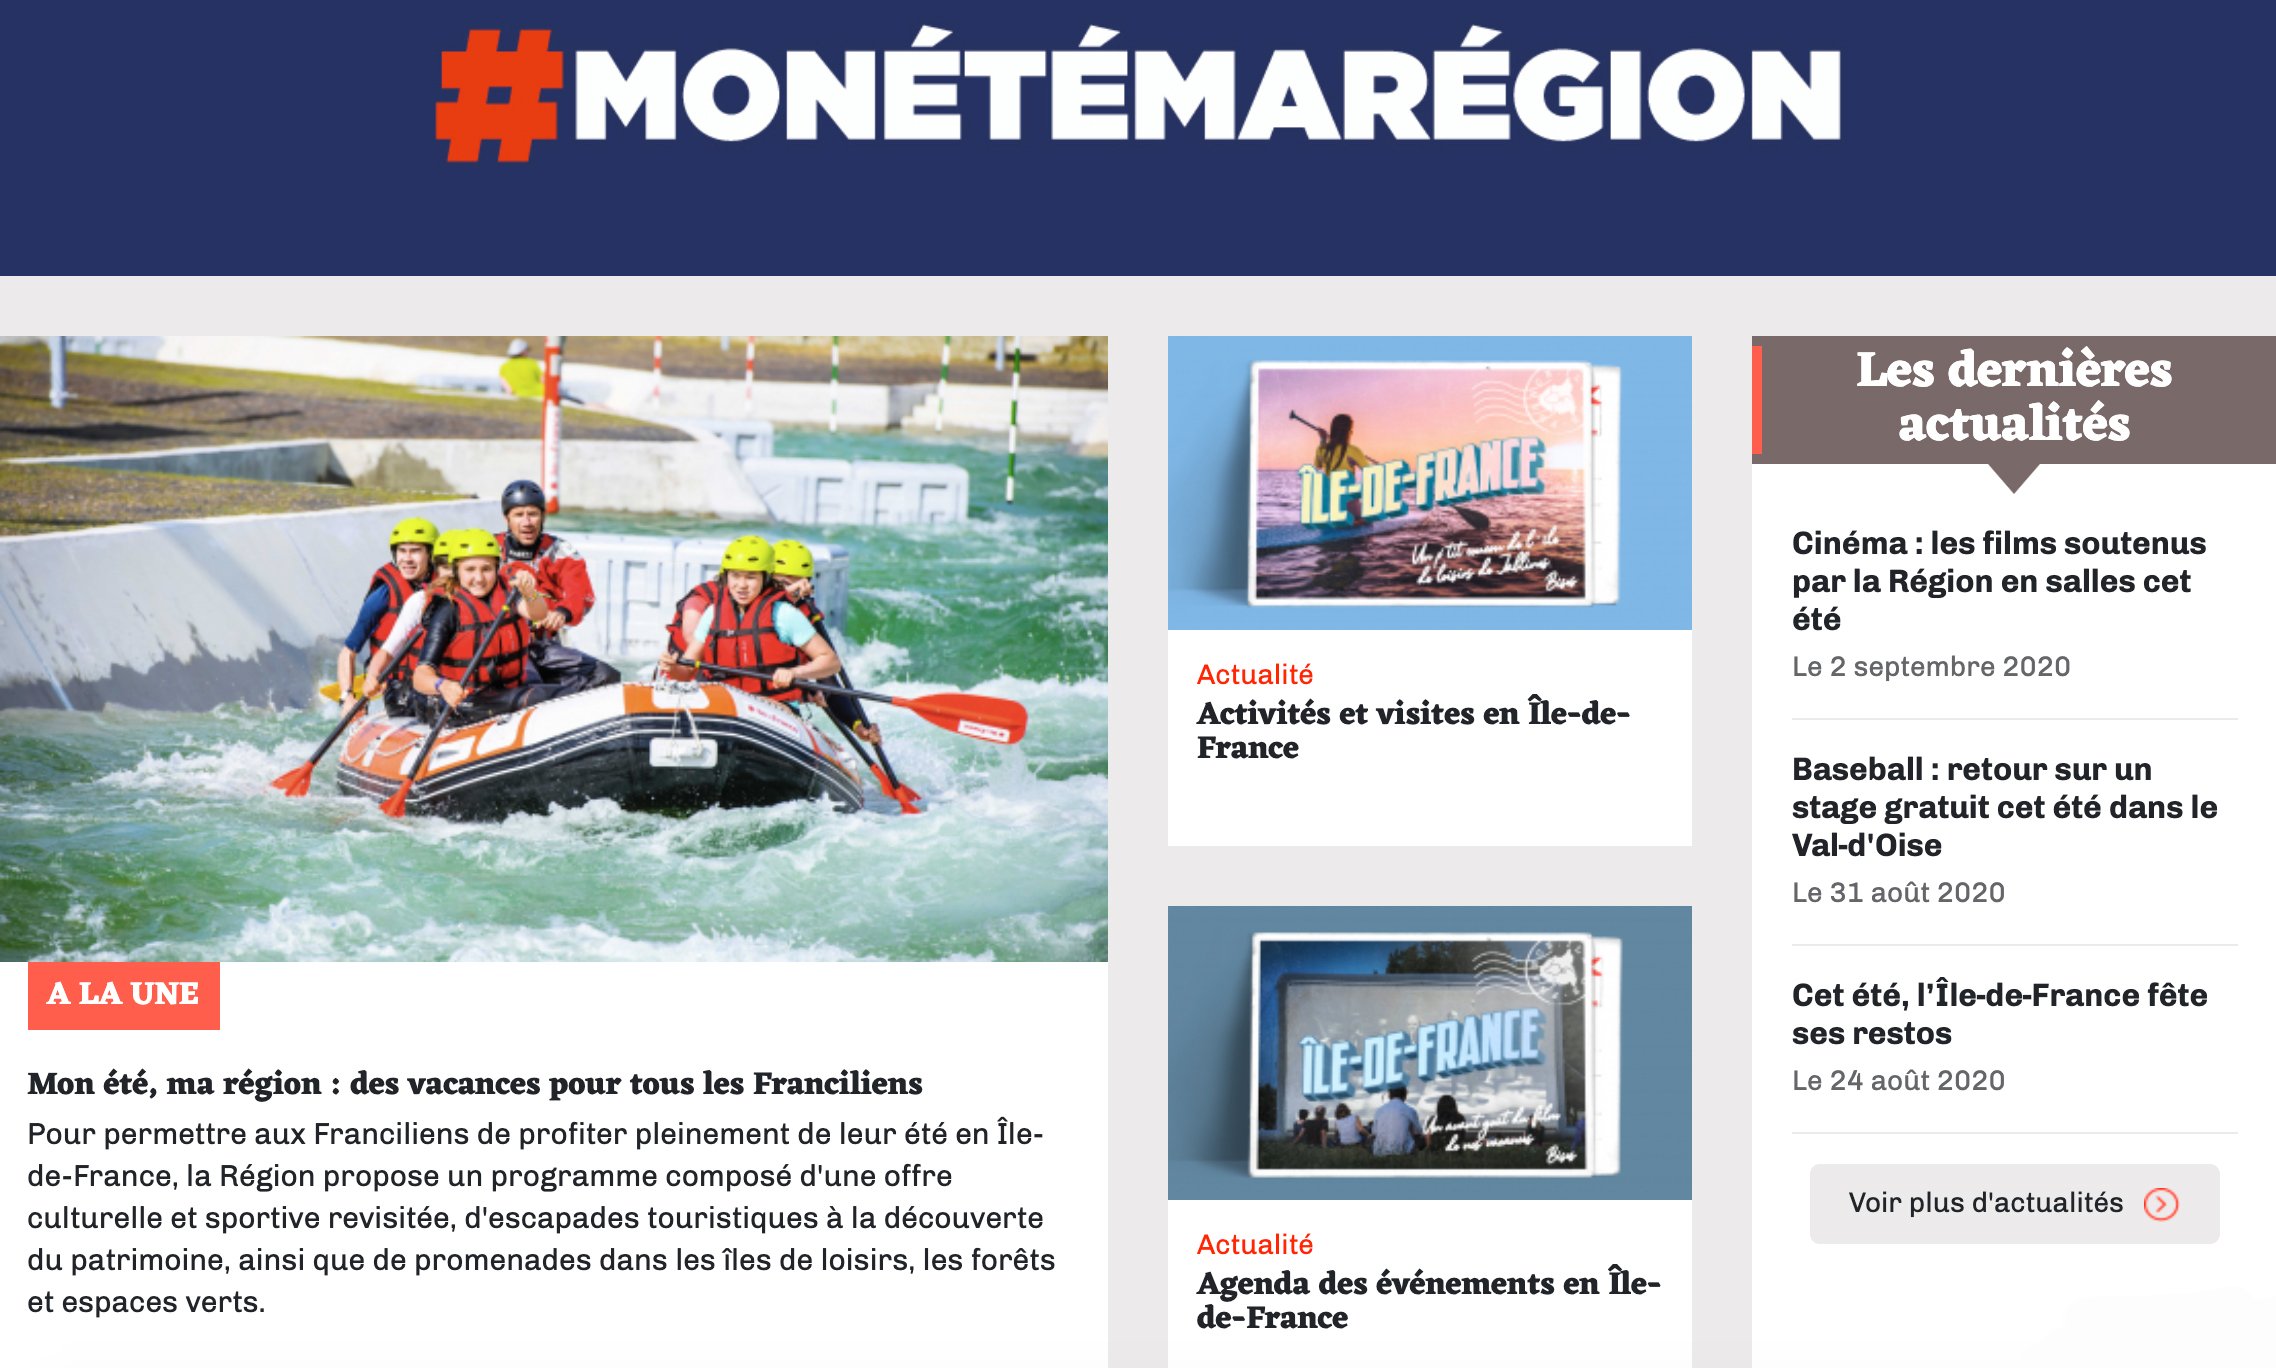
The Most Useful Services
The award goes to… MA RÉGION MON ÉTÉ, RÉGION ILE-DE-FRANCE
What to do around Paris during Summer
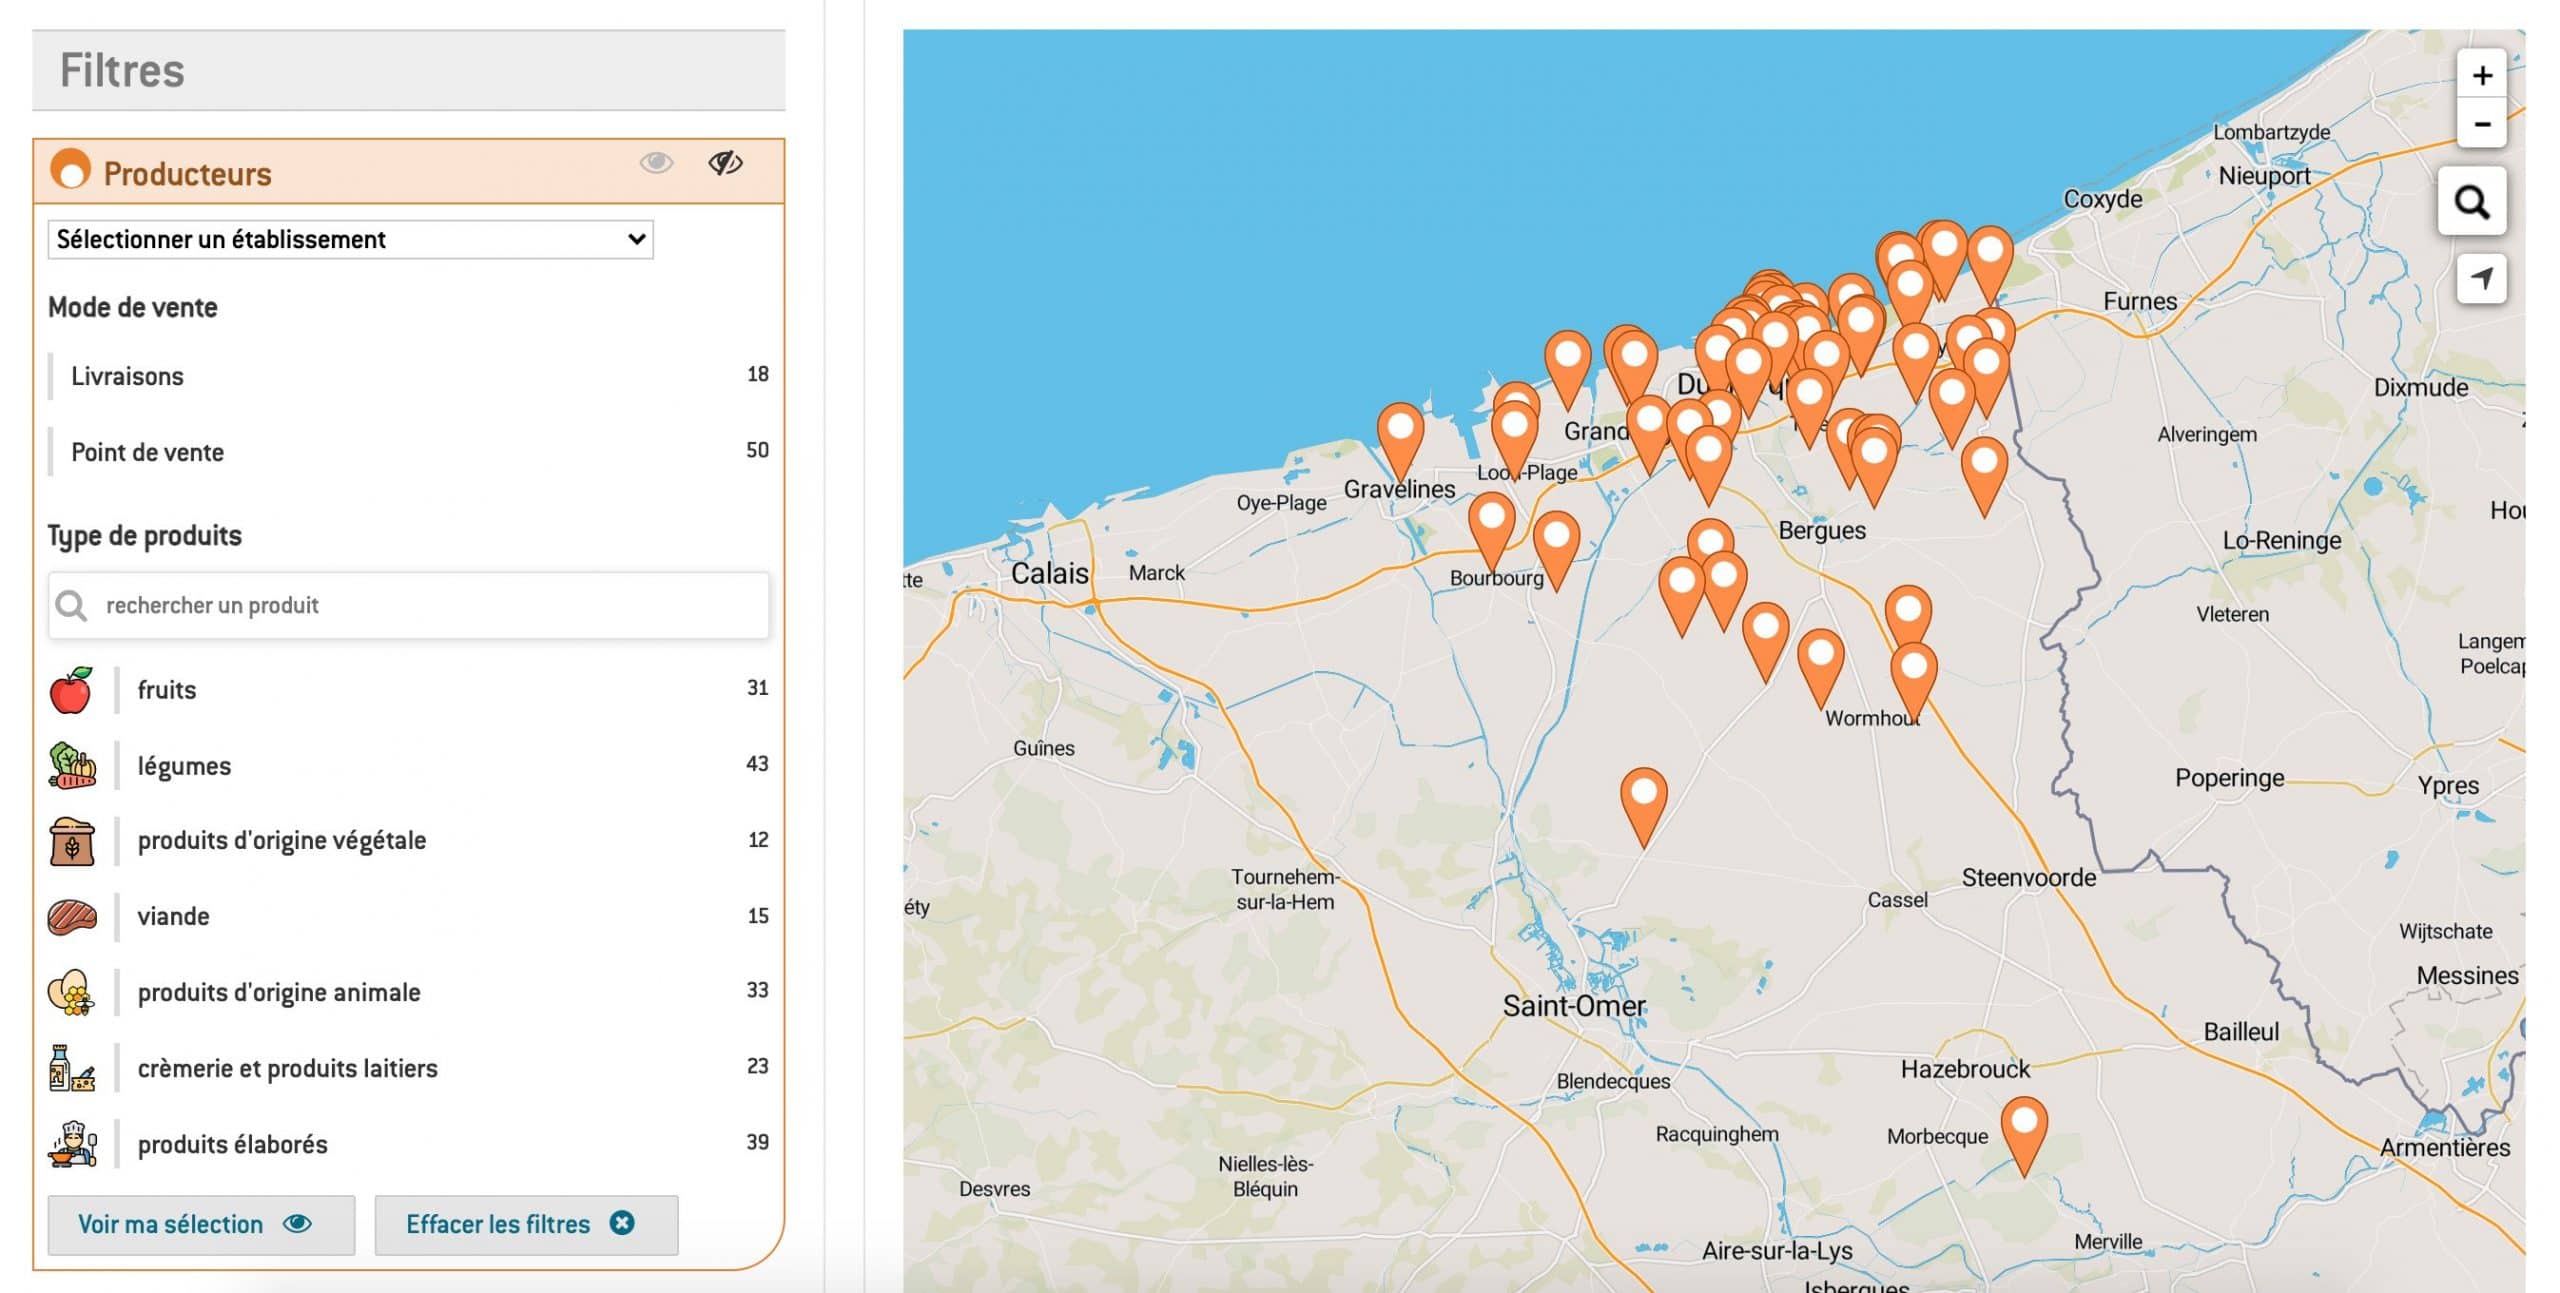
The award also goes to… DUNKERQUE, FRANCE
How to find open local businesses
The Most Active Users
The award goes to… OSBM, NC, USA
A State comparison dashboard to have an idea at a glance according to a topic
The award also goes to… RÉGION CENTRE VAL DE LOIRE, FRANCE
Architecture & tourism

The award also goes to… GPSO, FRANCE
A dashboard to empower users and increase internal efficiency with a list of online resources.
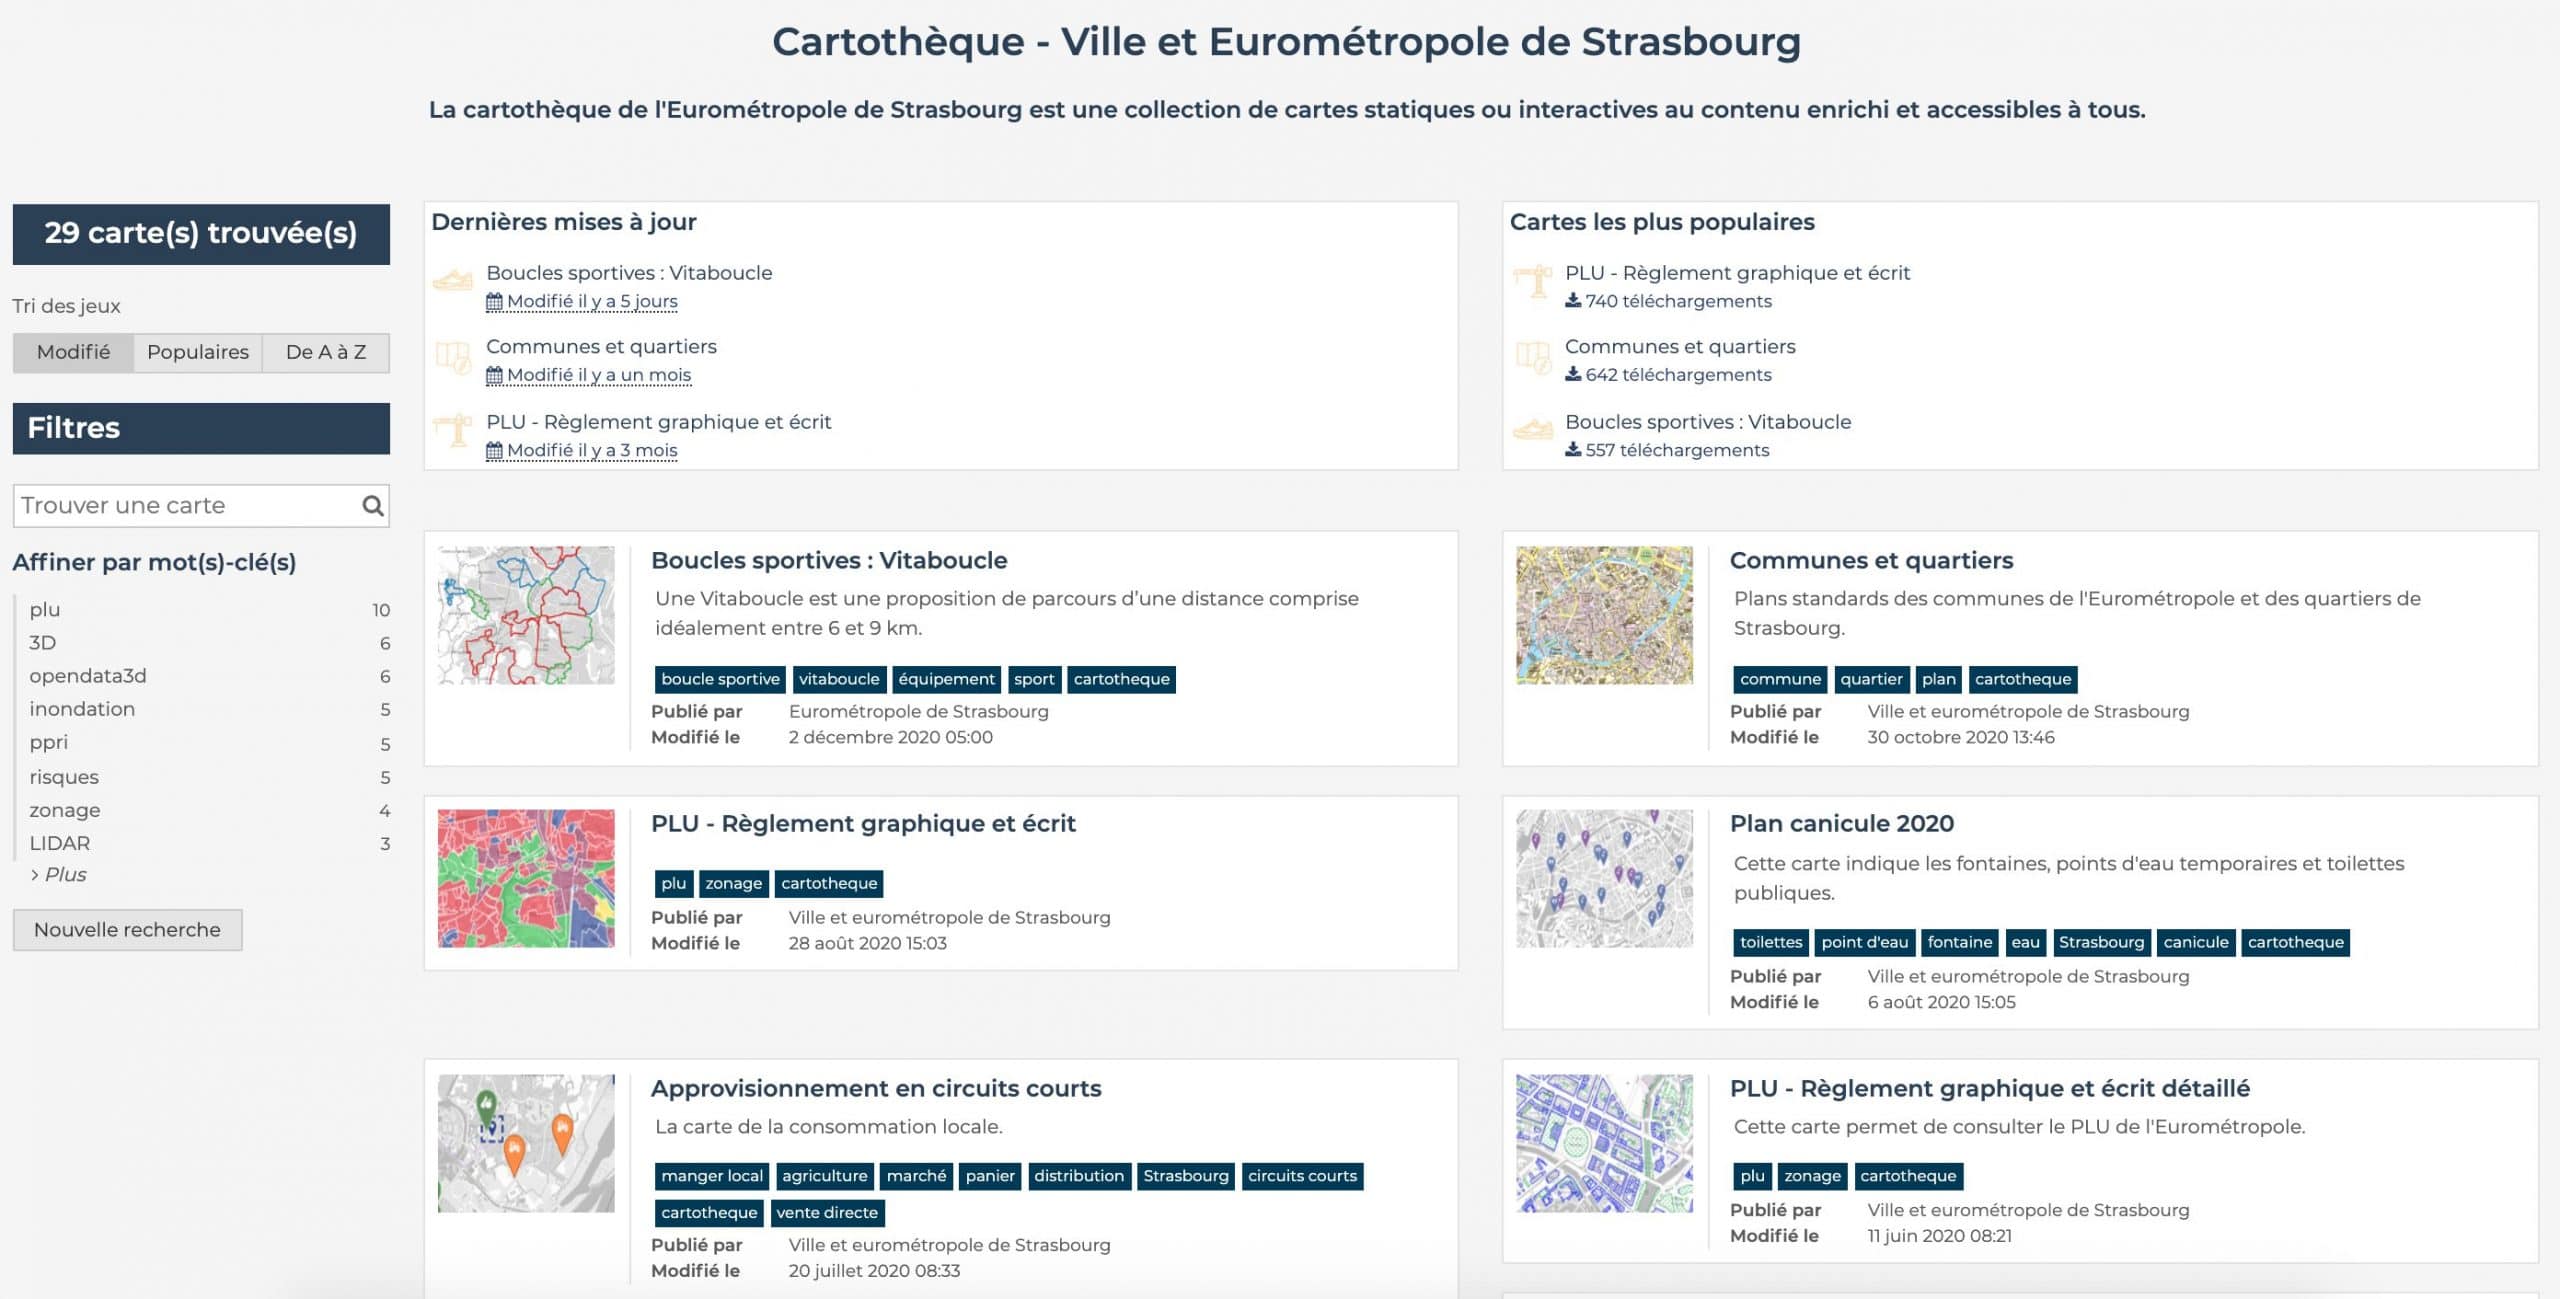
The Most Motivated ODS Academy Students
The award goes to… STRASBOURG EUROMETROPOLIS, FRANCE
A tailormade map library and an invitation to create more…
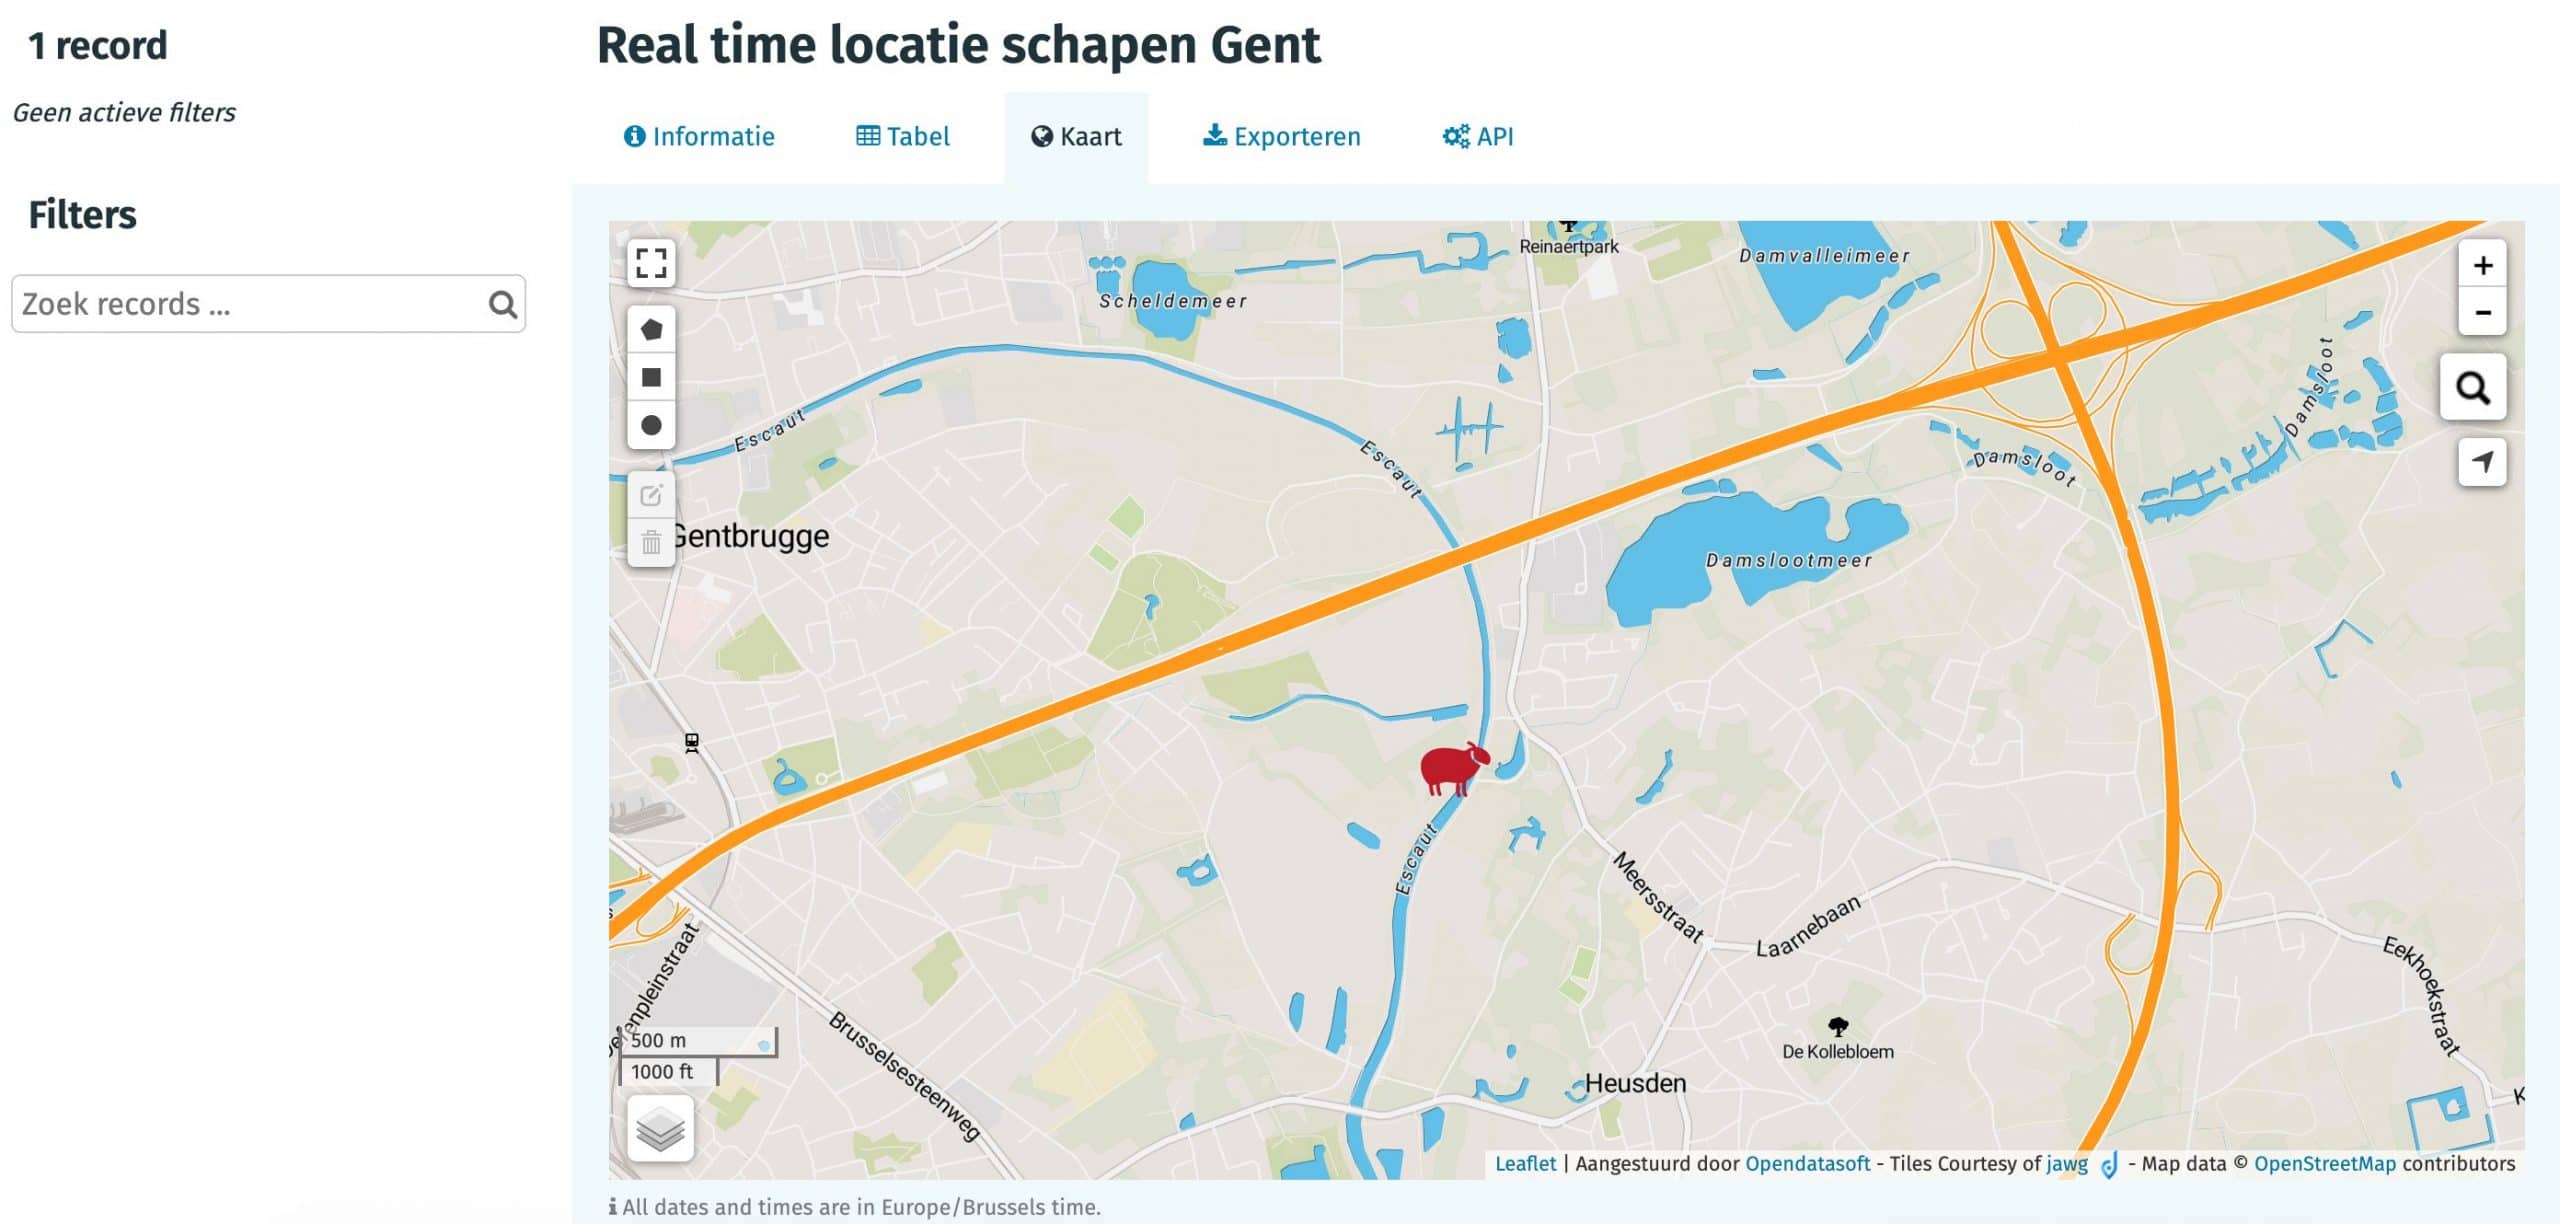
The Most Surprising Data
The award goes to… GHENT, BELGIUM
Sheep with a shepherd… IoT
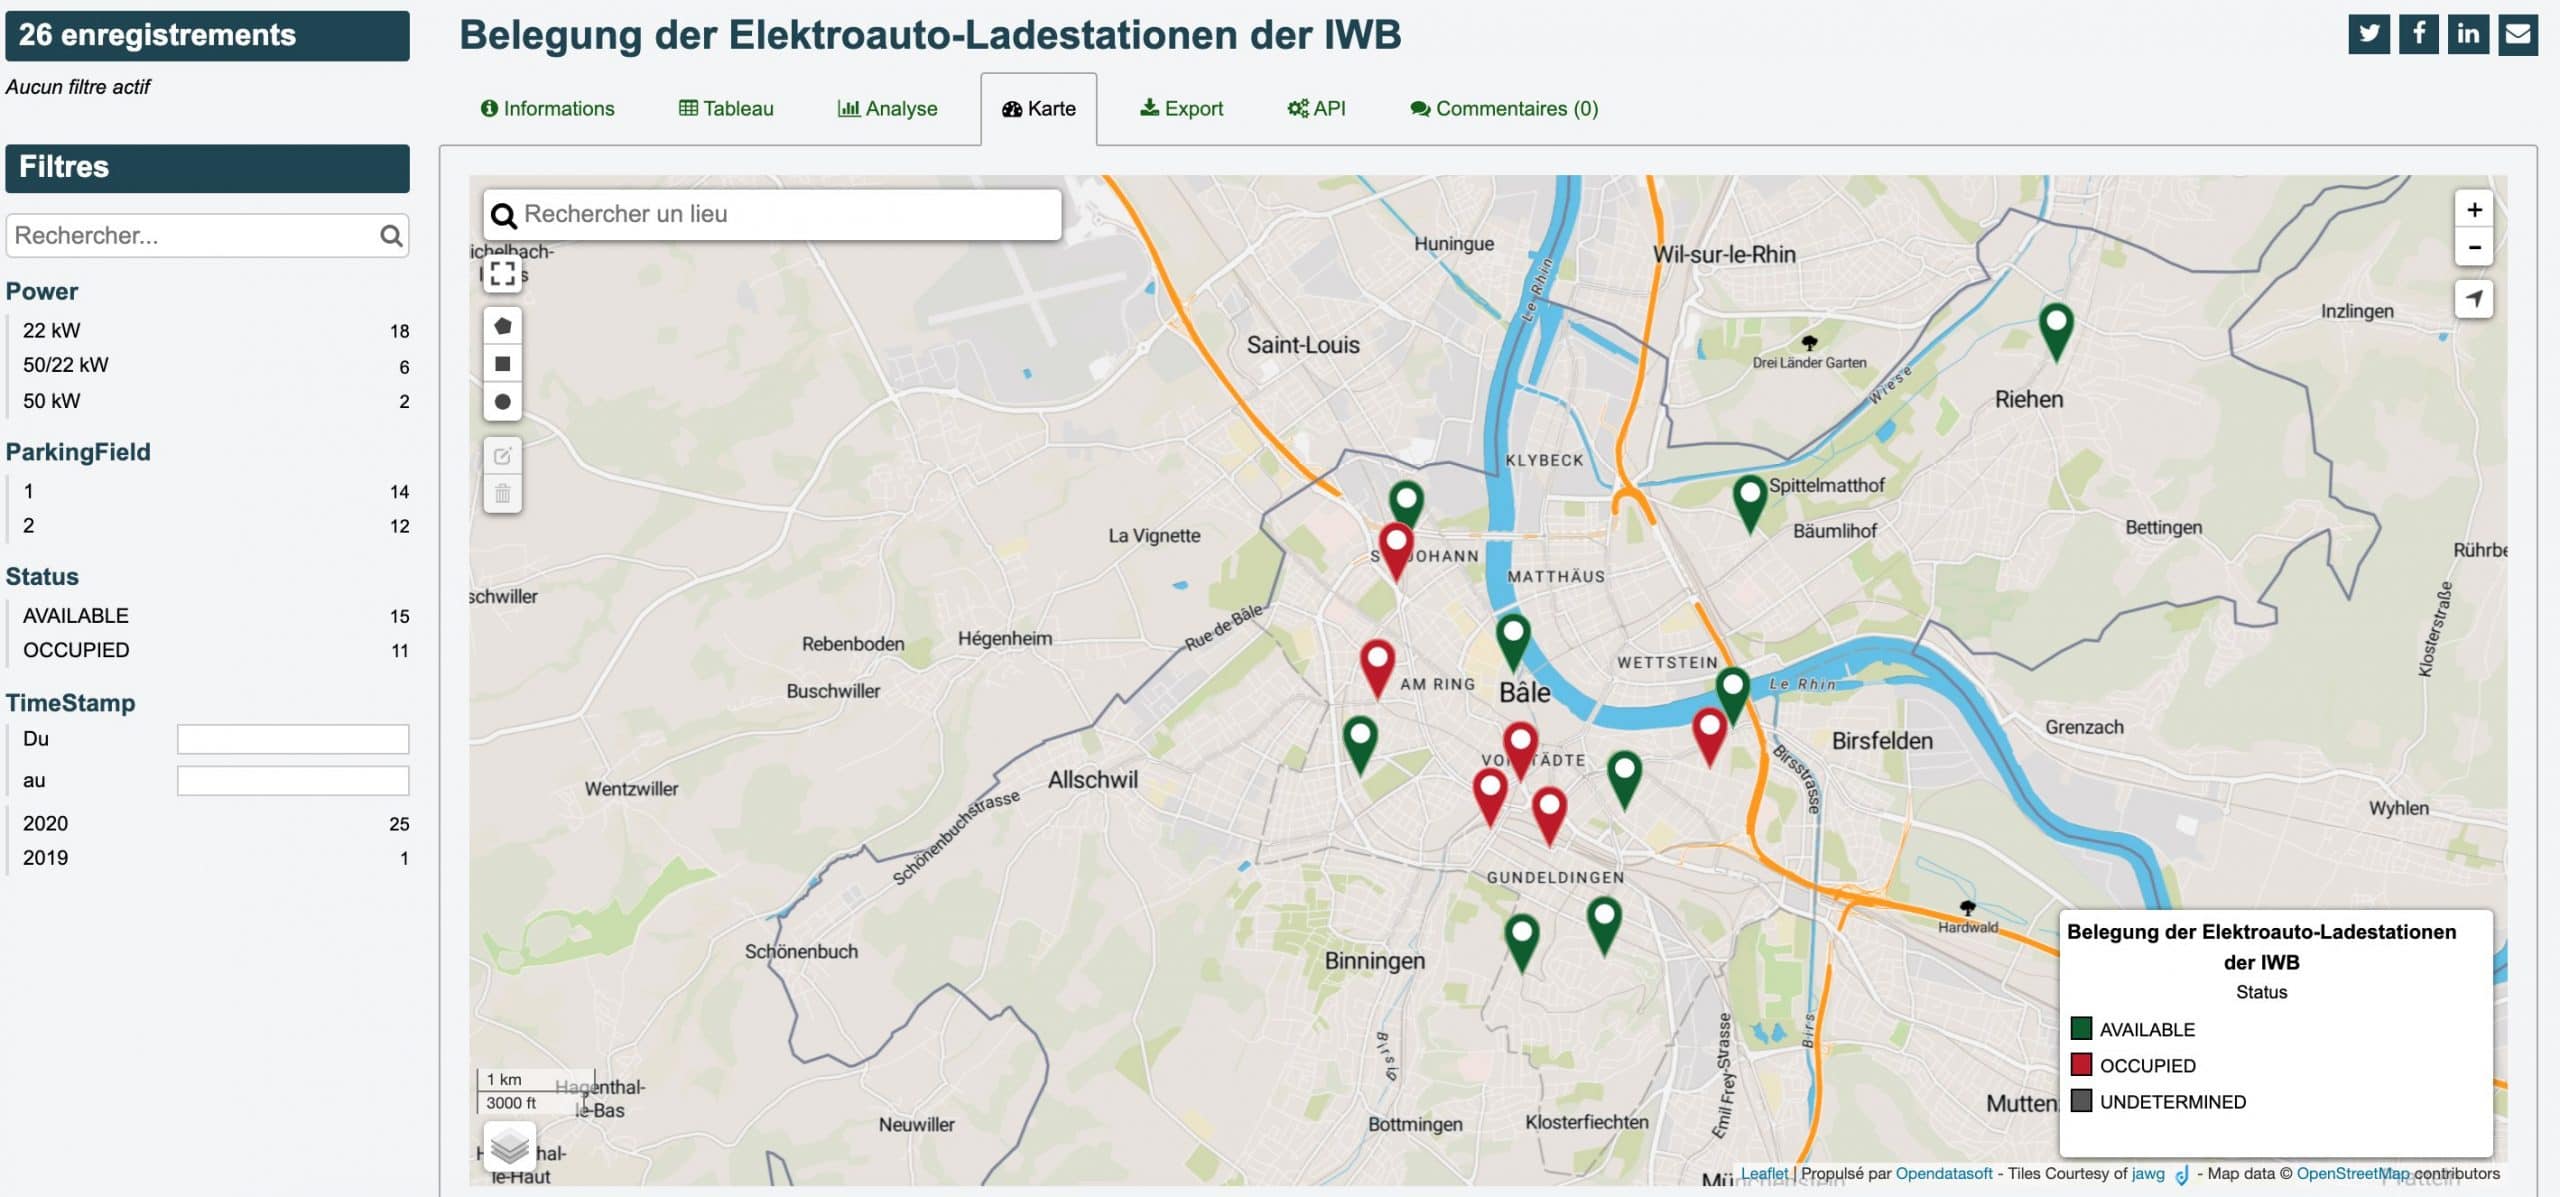
The Nicest Message to the Support Team
The award goes to… BASEL STADT, SWITZERLAND
Custom views with statistics or a real-time mobility map
We’re looking forward to see what next year’s winners will have created.
See you soon for more datadventures.


