Glossary
Dashboard as a Service (DaaS)
Dashboard as a Service (Daas) is a cloud-based solution that enables the easy creation of online dashboards without requiring deep technical skills.
What is Dashboard as a Service (DaaS)?
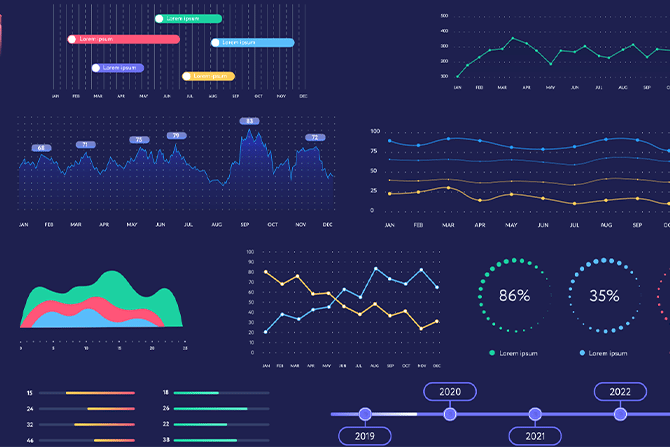
Dashboard as a Service (Daas) is a cloud-based solution that enables the easy creation and deployment of online, customized, interactive dashboards without requiring deep technical skills. These dashboards bring together data from multiple sources in a single place to enable actionable insights and reporting.
What are the benefits of Dashboard as a Service (DaaS)?
While many organizations create visual dashboards, normally the process of creating them is time-consuming, resource-intensive, and requires specific technical expertise. Dashboard as a Service solutions overcome these barriers by providing a simple, user-friendly interface, connectors, and templates to simplify and automate the process of data integration, visualization, and analysis. This democratizes data access, improves collaboration and scales the creation of visual, interactive dashboards.
As well as providing dashboards for internal use, Dashboard as a Service solutions enable organizations to monetize and share their data, creating new data services for customers and partners and creating new revenue streams.
Dashboard as a Service solutions deliver nine key benefits:
- They provide timely, actionable insights to managers, driving better decision making
- They enable performance against KPIs to be tracked, through an intuitive, visual display
- They combine multiple sources of information in a single, understandable view
- They are interactive, enabling managers to drill down into data and ask “what if?” questions
- They empower everyone within the organization, enabling them to create their own dashboards, based on their specific needs, industrializing data use
- They increase efficiency as business analysts can focus on more strategic priorities rather than solely creating dashboards for managers
- They are cost-effective and scalable. Thanks to the cloud-based model organizations don’t need to invest in their own infrastructure or support
- They differentiate your business and enable new revenue opportunities by allowing the fast creation of dashboards that can be shared with customers
- They are accessible everywhere thanks to their cloud-based model, speeding deployment and sharing
How does Dashboard as a Service (DaaS) work?
Creating dashboards through a Dashboard as a Service solution is a simple, three stage process:
- Identify the data sources required for the dashboard, ensuring that they are high-quality, real-time, and anonymised if being shared externally
- Use the solution to create user friendly and intuitive dashboards through its drag and drop interface and build in connectors to data sources
- Share the dashboards internally with users or create a marketing/sales model to monetize these data services with external customers
What features should a Dashboard as a Service (DaaS) solution include?
To deliver real benefits Dashboard as a Service solution should cover the end-to-end data lifecycle and include these features:
- Connects to all sources. Your solution has to integrate with all of your data sources, from production and business systems to Internet of Things platforms. It should provide pre-built connectors to make integration simple and seamless.
- Ensures data quality. The solution should automatically standardize data to ensure consistency, accuracy, and the highest level of quality.
- Enriches data. It should enable you to easily enrich data by combining it with freely available datasets to make dashboards compelling and understanding. For example, it should allow you to add geographic or demographic data to create richer and more relevant data experiences.
- User-friendly. Unlike traditional business intelligence software, your Dashboard as a Service solution should be easy and intuitive to use, without requiring specialist technical training or skills. Look for a solution with a drag and drop/no code interface that empowers users to create their own dashboards and visualizations.
- Secure and compliant. It must protect data and ensure compliance through strong security, anonymization and access controls/permissions management
- Make sharing and monetization simple. Your solution should industrialize dashboard sharing and enable secure distribution at scale to external customers
- Monitor key metrics. Look for a solution that includes performance monitoring tools to analyze how your data is being used to drive reporting and improvements.
Learn more

Blog
Accelerating public sector data sharing – best practice from Australia
Data sharing enables public sector organizations to increase accountability, boost efficiency and meet changing stakeholder needs. Our blog shares use cases from Australia to inspire cities and municipalities around the world


