The recipe for a successful data service launch: 3 companies, 3 data missions
At Data on Board 2020 dozens of inspiring data stories were shared. These 3 contain the recipe for a successful data service launch!

This 5th of November, two days after the US presidential election, I participated in another (online) celebration: Data on Board!
It was my first time at the ODS annual summit and I was thrilled to experience the diverse adventures of our 30+ Data Heroes from across the private, public, and no-profit sectors (if you missed the event, this article is a wonderful recap: Open Data Enters a New Era).
Three of those data stories particularly caught my attention, because beyond their apparent differences, they shared fundamental principles that are key to the success of any data mission. Curious to know what these best practices are? Read this article to find out!
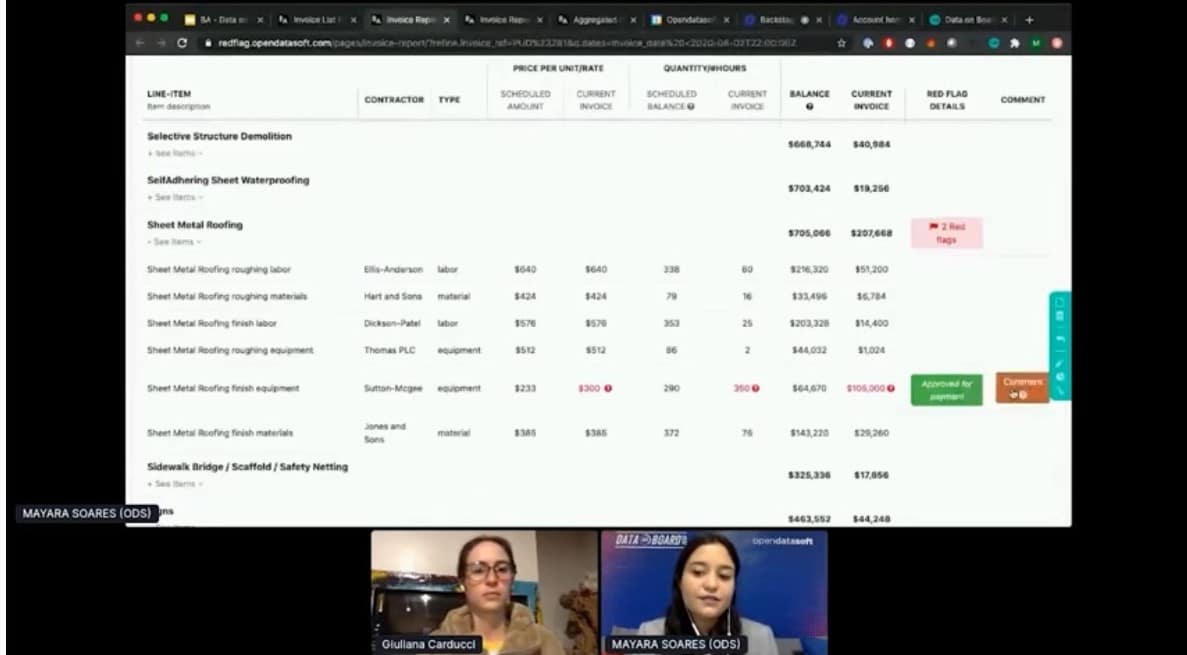
A data portal to prevent fraud
Rose Gill Hearn and Giuliana Carducci of the Municipal Integrity and Transparency Team at philanthropic consultancy Bloomberg Associates (BA) have a goal: help cities track fraud. “Contracting gives plenty of room for corruption, delays and waste, as municipalities struggle to monitor all the expenses incurred in complex projects” explains Giuliana. “We realized that an effective way to address this issue was bringing transparency to the process before invoices are paid”.
This is how BA came to partner with ODS to develop the Red Flag Software Tool, an instrument that allows cities to spot discrepancies between payment amounts agreed in contracts and incoming invoices. “In the main page project managers find an overview of the budget, schedule, and number of red flags attached to their projects” shows Mayara from the ODS team during a demo of the software. “The Invoice Summary helps them monitor the status of all invoices received and spot those that are flagged, while the Invoice Report shows the exact overcharges and enables project managers to take action by either approving or stopping payments. Lastly, the Project Report provides aggregated data on project indicators to facilitate decision-making” continues Mayara. “What we love about this tool is that it brings together the best of the human and the best of the machine” concluded Giuliana.
This doesn’t mean that uptake of this type of portal is always straightforward: cities must be ready to devote efforts and resources, particularly if they are transitioning from a paper-based to a digital system. Another challenge is maintaining the tool over time, especially as administrations change: it is imperative that the benefits of the software are apparent, that its use is intuitive for newcomers and, most importantly, that the political commitment to transparency continues.
If you’d like to know more about BA’s initiative, you can find the recording of our chat with Giuliana here, while if you are interested in open contracting you can discover more in this article.
A data portal to improve customer trust
Transparency is a guiding principle also for Bureau Veritas, a global audit company which uses ODS-powered portals to display data about the quality, security and compliance results of the companies it evaluates. “We were looking for an easy, integrated and highly customizable solution to publish data for our clients” recalls Chief Technology Officer Thomas Daubigny. “We opted for ODS because it brings together an appealing design with advanced data analysis capabilities” he continues. “Our internal experts can easily plug in data from diverse sources, including Excel sheets, databases and data lakes, and add to the portal the functionalities that clients require, like access permissions, within a day”.
This type of data service is becoming increasingly popular among BV customers: “With all the uncertainty brought about by Covid, more and more companies are trying to earn customers’ trust by being transparent about their audits, especially those of hygiene protocols” explains Thomas. “This is not always an easy choice, because some fear that competitors will take advantage of the information. But we are convinced that the most transparent companies are those that will succeed in the long run”.
So, what’s the recipe for such a successful data initiative? “There are 3 key ingredients” summarizes Thomas. “First, adopt an agile development approach: set up an operational pilot of the portal within 2 weeks, so you can test it and improve it iteratively based on internal and customer feedback. Second, put hybrid professionals in charge of the portal: they must be UX designers, full stack developers and data scientists at the same time, while also knowing your core business well. Lastly, establish a strong data management strategy: the cleaner your data are, the better the service you can provide to your client”.
If you’d like to know more about BV’s initiative, you can find the recording of our chat with Thomas here.
A data portal to support decision-making
At Underwriters Laboratories (UL), a global safety certification company, Alliance and Innovation Manager Melissa Albrecht is in charge of an ambitious project: to centralize external and internal data to support decision-making in the Covid era. To this end, she reached out to ODS to set up the Start Safe Recovery Portal, an intuitive and easily searchable tool built, like BV portals, with a design thinking approach.
“In the worldwide overview you can see an overlay of Covid data (both case counts and deaths), normalized by 100K inhabitants, with UL office locations” explains Melissa during a software demo. “At country level, you can see cumulative and time-series Covid data, as well as the evolution of the stringency index” continues Melissa zooming into Morocco. “The unique feature of this tool is the summary of the latest local mandates, such as workplace closures and travel bans, and the link to their sources”.

Just like BA, UL too faced obstacles to uptake of the software: “The initial adoption rate was a challenge, as we thought Covid was a time-bound event” recalls Melissa. “When in the summer we realized it was not, we transitioned from “this is interesting” to “what can we do with it”?”. Change management plays a crucial role in this process: employees from different teams must be trained to interpret the data and be assured about the trustworthiness of the portal as their primary source of information. For this to happen, Melissa wants to include the sources which site leaders usually refer to, including text-based, unstructured data about local mandates. In the future, she also plans to add demographic and economic indicators with a view to ensure the long-term sustainability of the project.
If you’d like to know more about UL’s initiative, you can find the recording of our chat with Melissa here.
To sum up, what lessons can we draw from BA, BV and UL’s experiences? Here are 5 ideas:
- Organize your internal and external data: it’s essential to deriving insights, spotting inefficiencies and building data services.
- Pilot and iterate: the best data service is the one that you build with your stakeholders.
- Guide the transition: rely on change management strategies to ensure uptake of your data service.
- Embrace transparency: it’s an asset that improves trust and efficiency in your organization.
- Plan for the long-term: the data services that have the most impact are those that are made to last.
See you soon for more datadventures!


