04 February 2025
Data product marketplaces empower businesses and data leaders with the ability to industrialize data sharing and consumption to create data value. We look at the key foundations you need to put in place to ensure your data product marketplace successfully generates value, increases usage and drives ROI.
Category
Filter by keywords
12 May 2022
Organizations across the world are increasingly looking at how they can turn their data into value by sharing it with their internal and external communities. To find out what is happening in the Australian market we interviewed Opendatasoft partner Peclet Technology.
10 May 2022
We’ve all seen the formula, popularized by Airbnb and Google Maps, with a list on one side, a map on the other, a search field, and a geolocation button. How can you create your own version, based on sharing your data?
03 May 2022
Increasing data usage and driving data democratization relies on users engaging with your data. You cannot just build a portal, hope people will come and then know how to use your data. We explain four best practices for increasing engagement, based on international customer experience.
25 April 2022
Looking to make your data more accessible and usable, but not a data specialist? Learn more about how the ODS Academy, Opendatasoft’s learning resources platform, can help.
19 April 2022
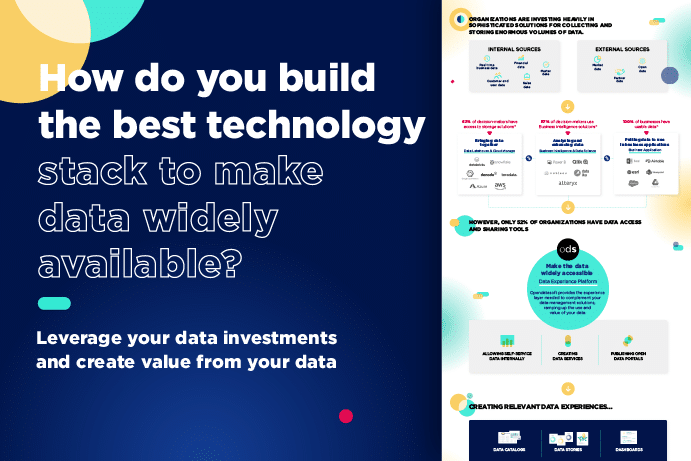
Organizations are investing heavily in sophisticated solutions for collecting and storing enormous volumes of data. But are these investments worthwhile? Do they release data’s full potential and value?
04 April 2022
We recently looked into the data future with Engie, IQVIA, Altares, and SNCF Réseau at our Data on Board conference. Together, we time-traveled to the year 2031, looking at when data is truly accessible to all.
31 January 2022
Opendatasoft recently launched ODS Studio, a no-code tool for creating data visualizations, to complement our existing HTML page editor. To learn more we talked to Benoît Fortuné, the Product Manager who led this project
17 January 2022
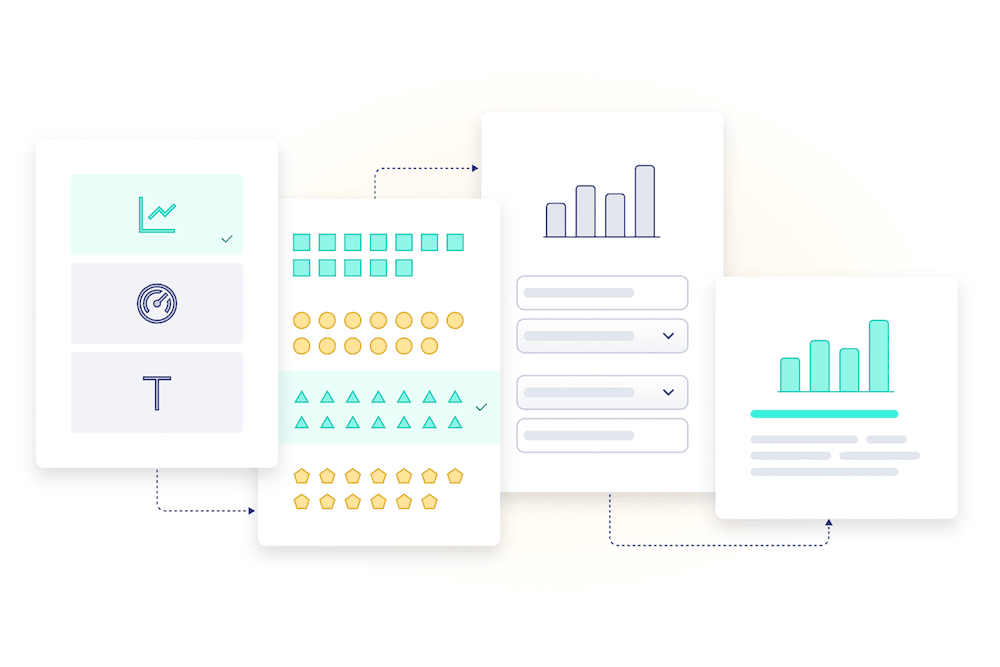
With our new ODS Studio tool, you can design 100% responsive data stories and reports in minutes, without needing to write a line of code or perform complex calculations.
09 September 2021
Illustrate, share, show, demonstrate, develop… So many verbs to refer to the visual depiction of data. It’s indeed for the purpose of “sharing data” that they’re first and foremost expressed in a visual form.
23 November 2020
Improving your ability to tell stories with data is an important way to engage key audiences. This blog will attempt to shed some light on how data storytelling can help you deliver key messages and ultimately spread the good word about data to more people.
16 March 2020
Access to data is changing the way in which we all work. We sat down for a chat with Aura Cifuentes, Director of the Public Innovation Team at the National Development Department for the Government of Colombia.
18 October 2019
Thanks to its connected scale and the data it generates, Spare-it helps organizations engage employees to reduce their environmental impact and foster a corporate sustainability culture.

